Showing posts with label Lang_Python. Show all posts

Friday, May 27, 2011

Ellipse detection in image by using Hough transform

How we can detect ellipses in images ? One way is to use Hough transform. I will use Hough transform algorithm variant created by Yonghong Xie and Qiang Ji. That algorithm pseudo-code:

1. Store all edge pixels in a one dimensional array.
2. Clear the accumulator array.
3. For each pixel (x1, y1), carry out the following steps from (4) to (14).
   4. For each other pixel (x2, y2), if the distance between
   (x1, y1) and (x2, y2) is greater than the required least
   distance for a pair of pixels to be considered then
   carry out the following steps from (5) to (14).
      5. From the pair of pixels (x1, y1) and (x2, y2) calculate the center,
      orientation and length of major axis for the assumed ellipse.
      6. For each third pixel (x, y), if the distance between
      (x, y) and (x0, y0) is greater than the required least
      distance for a pair of pixels to be considered then
      carry out the following steps from (7) to (9).
         7. Calculate the length of minor axis.
         8. Increment the accumulator for this length of minor axis by 1.
         9. Loop until all pixels are computed for this pair of pixels.
      10. Find the maximum element in accumulator array. The
      related length is the possible length of minor axis
      for assumed ellipse. If the vote is greater than the
      required least number for assumed ellipse, one
      ellipse is detected.
      11. Output ellipse parameters.
      12. Remove the pixels on the detected ellipse from edge pixel array.
      13. Clear accumulator array.
      14. Loop until all pairs of pixels are computed.

Proof-of-concept algorithm implementation in Python:
import sys
from PIL import Image,ImageFilter, ImageDraw
from math import *

# some global constants
EL_COVERAGE_RATIO = 0.9
EL_VERIFICATION_DISTANCE = 1.
EL_PATH_POINTS = 51
MIN_MINOR_FREQUENCY = 30
MIN_HALF_MAJOR = 8
MIN_HALF_MINOR = 6

def distance(p1,p2):
 x1,y1 = p1
 x2,y2 = p2
 return sqrt((x1-x2)**2 + (y1-y2)**2)

def nonnegative(v):
 return v if v >= 0 else 0

def parametricEllipse(center, a, b, angle):
 xc,yc = center
 elx = lambda t: xc + a * cos(t) * cos(angle) - b * sin(t) * sin(angle)
 ely = lambda t: yc + a * cos(t) * sin(angle) + b * sin(t) * cos(angle)
 return [(int(elx(2.*pi*x/float(EL_PATH_POINTS-1))),int(ely(2.*pi*x/float(EL_PATH_POINTS-1)))) for x in range(EL_PATH_POINTS)]

assert len(sys.argv)!=2, "missing input and/or output file !"

im = Image.open(sys.argv[1])
width, height = im.size
io = Image.new('RGB',(width, height),(255,255,255))
draw = ImageDraw.Draw(io)

# converting image to grayscale
im = im.convert('L')

# detecting edge pixels
im = im.filter(ImageFilter.FIND_EDGES)

# converting to binary image
im = im.convert('1')
pixels = im.load()
pxy = []

# extracting binary pixels coordinates
for x in range(width):
 for y in range(height):
  if pixels[x,y]==255:
   pxy.append((x,y))

# applying Hough transform for ellipses detection.
# algorithm is taken from this paper:
# http://citeseerx.ist.psu.edu/viewdoc/download?doi=10.1.1.1.8792&rep=rep1&type=pdf
cIx = -1
colors = [(255,0,0),(0,200,0),(0,0,255)]
for x1,y1 in pxy:
  for x2,y2 in pxy:
    bbins = {}
    dist = distance((x1,y1),(x2,y2))
    if dist >= 2*MIN_HALF_MAJOR:
     cent = ((x1+x2)/2.,(y1+y2)/2.)
     a = dist/2. # semi-length of major axis
     alfa = atan2((y2 - y1),(x2 - x1))
     for rx,ry in pxy:
      d = distance((rx,ry),cent)
      if d >= MIN_HALF_MINOR:
       f = distance((rx,ry),(x2,y2))
       cost = (a**2. + d**2. - f**2.)/(0.00001+2.*a*d)
       b = sqrt(nonnegative((a**2. * d**2. * (1.-cost**2.))/(0.00001 + a**2. - d**2. * cost**2.)))  # semi-length of minor axis
       b = int(b)
       if bbins.has_key(b):
        bbins[b]+=1
       elif b > 0:
        bbins[b]=1
     bbins_rev = dict([(v,k) for k,v in bbins.iteritems()])
     max_freq = max(bbins_rev.keys())
     bmax = bbins_rev[max_freq]
     # Did we found probable ellipse ?
     if max_freq >= MIN_MINOR_FREQUENCY and alfa >=0.0 and bmax >= MIN_HALF_MINOR:
      elData = parametricEllipse(cent, a, bmax, alfa)
      supported = []
      supportRatio = 0.0
      # counting how much pixels lies on ellipse path
      for i in range(EL_PATH_POINTS):
       elx,ely = elData[i]
       added = False
       for x,y in pxy:
        if distance((elx,ely),(x,y)) <= EL_VERIFICATION_DISTANCE:
         supported.append((x,y))
         if not added:
          supportRatio += 1./float(EL_PATH_POINTS)
          added = True
      supported = list(set(supported))
      # if number of pixels on ellipse path is big enough
      if supportRatio >= EL_COVERAGE_RATIO:
       cIx = (cIx+1)%3
       print "coverage %.2f" % supportRatio,"frequency ", max_freq, "center ", cent, "angle %.2f" % alfa, "axes (%.2f,%.2f)" % (a, bmax)
       # removing founded ellipse pixels from further analysis
       for p in supported:
        pxy.remove(p)
       # drawing founded ellipse
       for i in range(EL_PATH_POINTS):
        elx,ely = elData[i]
        if i < EL_PATH_POINTS-1:
         draw.line(elData[i] + elData[i+1], fill=colors[cIx])
io.save(sys.argv[2])
print "***************************************************************"
print "************************** DONE *******************************"
print "***************************************************************"

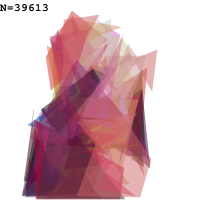
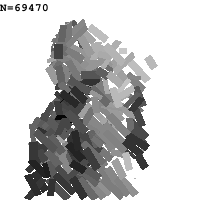
(Prototype algorithm is slow, tested only on 50x50 images). So, by running this algo on this image:
we will get such algorithm output:

Have fun in computer vision !

Sunday, June 21, 2009

Langton's ant Or order out of chaos

This time we will talk about Langton's ant - the simple system of simple rules, but with complex behavior. Simple system of Langton`s ant is defined as :
* At a white square, turn 90° left, flip the color of the square, move forward one unit
* At a black square, turn 90° right, flip the color of the square, move forward one unit
This is so called L/R system. But what if for the one color we will have not the one direction, but the direction chain ? That is- for the white squares we will have some chain of 'LRLRR...' events and for the black squares we will have another chain of 'RRLRRL...' events ?? Then we will get so called turmite - a 2D turing machine. So this experiment tests this turmite idea of multiple direction row for the same color. Experiment python script is this:


from Tkinter import *

rs = raw_input("Enter rule set (e.g.: L/R) => ")
str0 = rs.split('/')[0]
str1 = rs.split('/')[1]
i0, i1 = -1, -1
w,h = 500, 500
lx,ly = w/2, h/2
dirx,diry = 0,-1

# defining absolute directions
vec = {
(0,1,'L'):(1,0),
(1,0,'L'):(0,-1),
(0,-1,'L'):(-1,0),
(-1,0,'L'):(0,1),
(0,1,'R'):(-1,0),
(1,0,'R'):(0,1),
(0,-1,'R'):(1,0),
(-1,0,'R'):(0,-1)
}
mod = 2
grid = dict([((x,y),0) for y in range(0,h,mod) for x in range(0,w,mod)])

# Initialize Tk window
root = Tk()
ant = Canvas(root,width=w, height=h, bg='white')
ant.pack(fill=BOTH)

while 1:
if lx < w and ly < h and lx > 0 and ly > 0:
if grid[(lx,ly)] == 0:
i0 = (i0+1)%len(str0)
rdir = str0[i0]
elif grid[(lx,ly)] == 1:
i1 = (i1+1)%len(str1)
rdir = str1[i1]
dirx, diry = vec[(dirx,diry,rdir)]
grid[(lx,ly)] = grid[(lx,ly)]^1
col = "white" if grid[(lx,ly)] == 0 else "darkorange"
ant.delete("current")
ant.create_rectangle(lx, ly, lx+mod-1, ly+mod-1, fill="black",outline="black",tags="current")
ant.update()
ant.delete((lx,ly))
ant.create_rectangle(lx, ly, lx+mod-1, ly+mod-1, fill=col,outline=col,tags=(lx,ly))
lx,ly = lx+dirx*mod, ly+diry*mod


Results are somewhat interesting. At first, the classic Langton`s ant example-

Can we have system with shorter steps to "highway" ? Seems - yes we can. This is it:

But this is not the end. There is system which is almost "highway" from the scratch:


And finally- some exotic general Langton`s ant systems:


Conclusion
Seems that systems L/R and L/LRL is unstable and switches to stable system L/RLL.
Another conclusion is that there are some other systems that gets to the different types of "highway" - the order out of chaos.

Have fun with Langton`s ant !!

Sunday, March 15, 2009

Detecting copy-move forgery in images

This time I'll talk about digital image forensic and how to detect copy-move forgery in images. I`ve implemented some ad-hoc algorithm for detection of this kind of forgeries. Algorithm is robust, so it can detect forgeries in lossy image formats- such as JPEG. Please keep in mind - this algorithm is experimental toy, if you want more general solutions - you should read this paper or maybe this to get some ideas in the field. BTW, this algorithm is only tested with Python 2.6, so you better install Python 2.6.

Robust detection algorithm steps
1. Blur image for eliminating image details
2. Convert image to degraded palette
3. Decompose image into small NxN pixel blocks
4. Alphabetically order these blocks by their pixel values
5. Extract only these adjacent blocks which have small absolute color difference
6. Cluster these blocks into clusters by intersection area among blocks
7. Extract only these clusters which are bigger than block size
8. Extract only these clusters which have similar cluster, by using some sort of similarity function (in this case Hausdorff distance between clusters)
9. Draw discovered similar clusters on image

Copy-move detection script usage instructions
Run script from the command line - cmd in Windows or terminal in Linux.
1. At first try to execute script with default parameters-
python detect_copymove.py image_file.jpg

2. Then try to lower block color deviation threshold-
python detect_copymove.py image_file.jpg --blcoldev=0.05

3. Finally - run script in manual mode and try to spot similar regions by eyes-
python detect_copymove.py image_file.jpg --blcoldev=0.05 --imauto=0

If by trying all 3 steps - no copy-move tamperings revealed - there is a good chance that really there are no such tamperings in image. BTW, script has more parameters, full list of them -
python detect_copymove.py --help

Experiments - object cloning forgery
This type of forgery tries to deceive viewer that there were more objects than really was.
Original picture:

Doctored image:

Copy-move script output:

As you see script detected cloning of one tank, but did not detected cloning of tank in further row. This can be because of small size of that tank and because that tank is on boundary of image.

Experiments - object hiding forgery
In this type of forgery viewer is deceived that there were less objects than in reality was.
Original image:

Doctored image:

Copy-move script output:


Experiments - mixed type forgery
In this type of forgery some objects was hidden, some - cloned.
Original picture:

Doctored image:

Copy-move script output:

As you see script detected 2 forgeries - cloning of dog, and cloning of background (which was done with intention to hide other dog)

Conclusions
Copy-move forgery detection script works not bad. However it is also not perfect of course (may not detect all tamperings, so called false negative rate is not zero of course). And I`ve not tested very well, but I suppose script also have false positive rate - i.e. can detect areas which actually was not tampered. But all in all - I think this algorithm is pretty obvious and can be simply implemented and used as first line of defense against copy-move forgeries.

Have fun in copy-move forgeries hunting !!

Saturday, February 21, 2009

Evolving first lady of the internet

At last I ported selfish gene algorithm into Python. This algorithm pseudo-code is: 1. Encode some solution into set of genes. 2. Set default probability for each gene. 3. Generate 2 random solutions, according to genes probability. 4. Compare these 2 solutions: for better solution- increase it`s genes probability by some value for worse solution- decrease it`s genes probability by some value 5. Repeat everything from 3, until needed. Now, interesting part. What can we do with selfish gene algorithm ? After seeing this post about genetic programming and evolutionary art, I`ve decided to try something similar. But only by using selfish gene algorithm. I`ve tried 2 experiments - tried to evolve picture of first lady of the internet composed of polygons. And second experiment - lenna picture is evolved as some number of lines. So experiment idea is to generate 2 random images, composed of random polygons (or lines in other experiment) and to compare these 2 images. For image which is more similar to original lenna picture - we increase polygons probability, for other picture - decrease polygons probability. In the long run - "good polygons" tends to group together. Below are the results of these experiments. Evolved pictures of lenna are compiled as frames of animated GIF image. N - is the iteration number (starting from zero): Lena evolved as set of polygons
Original LenaLena evolution: 39614 iterations 100 polygons 3.5 hours experiment code
Lena evolved as set of lines
Original LenaLena evolution: 69471 iterations 200 lines 2.5 hours experiment code
Conclusions: Selfish gene algorithm (sort of evolution strategy algorithm) is suitable for solving search and optimization problems, including generation of evolutionary art :-) Below are final iteration pictures better quality than gif:
Have fun with selfish gene algorithm, genetic algorithms and evolution art !

Wednesday, December 3, 2008

Project Euler p83 and Dijkstra's algorithm

Problem definition:
-----------------------------------------------------------
In the 5 by 5 matrix below, the minimal path sum from the top left to the bottom right, by moving left, right, up, and down, is indicated in bold and is equal to 2297.

131 673 234 103 18
201 96  342 965 150
630 803 746 422 111
537 699 497 121 956
805 732 524 37  331

Find the minimal path sum, in matrix.txt , a 31K text file containing a 80 by 80 matrix, from the top left to the bottom right by moving left, right, up, and down.

-----------------------------------------------------------
Problem is solved with the help of Dijkstra's algorithm
Answer is calculated in a 2.5 seconds. Also it is not optimized,- computes distances to all nodes in network. To speed up - when we find target node - we can only check these nodes which distance is less than target node distance. Also this code suits equally well for solving project euler problem no 81 - only change shortestpath() function parameter "directions". And finally - this solution shows shortest path visually,- prints it to screen. Program code:


import time as t

def readmatrix(filename):
f=open(filename, 'r')
m=[map(lambda x: int(x),r.strip().split(",")) for r in f.readlines()]
return m

def nextcell(dctresults):
minw = 10000000
mink = None
for k in dctresults:
if not dctresults[k][2]:
if dctresults[k][1] < minw:
minw = dctresults[k][1]
mink = k
return mink

def analyzecell(lstmat, tupcell, lstdirec, dctresults):
i,j = tupcell
for dr in lstdirec:
di,dj = dr
if (i+di) in range(len(lstmat)) and (j+dj) in range(len(lstmat)):
if not dctresults.has_key((i+di,j+dj)):
dctresults[(i+di,j+dj)] = [(i,j),dctresults[(i,j)][1]+lstmat[i+di][j+dj],False]
else:
oldw = dctresults[(i+di,j+dj)][1]
neww = dctresults[(i,j)][1]+lstmat[i+di][j+dj]
if neww < oldw:
dctresults[(i+di,j+dj)][0] = (i,j)
dctresults[(i+di,j+dj)][1] = neww
dctresults[(i,j)][2] = True

def shortestpath(filename, directions):
mat = readmatrix(filename)
results = {}
results[(0,0)] = [None,mat[0][0],False]
cell = nextcell(results)
while cell:
analyzecell(mat,cell,directions,results)
cell = nextcell(results)
return results, results[(len(mat)-1,len(mat)-1)][1], mat

def showpath(res, inpmat):
print ' '+'-'*len(inpmat)+' '
pathcells = []
curc = (len(inpmat)-1,len(inpmat)-1)
while curc:
pathcells += [curc]
curc = res[curc][0]
for i in range(len(inpmat)):
s='|'
for j in range(len(inpmat)):
s+= '#' if (i,j) in pathcells else '.'
print s+'|'
print ' '+'-'*len(inpmat)+' '

t1 = t.time()*1000
resd, pathsum, mat = shortestpath('matrix.txt',[(-1,0),(+1,0),(0,-1),(0,+1)])
t2 = t.time()*1000
print 'Shortest path sum', pathsum, '; Calculation time is ', int(t2-t1), 'ms'
showpath(resd, mat)


Have fun with shortest path algorithms !!!

Tuesday, November 11, 2008

Project Euler p92

Problem description:
-------------------------------------------------------------------
A number chain is created by continuously adding the square of the digits in a number to form a new number until it has been seen before.

For example,

44 -> 32 -> 13 -> 10 -> 1 -> 1
85 -> 89 -> 145 -> 42 -> 20 -> 4 -> 16 -> 37 -> 58 -> 89

Therefore any chain that arrives at 1 or 89 will become stuck in an endless loop. What is most amazing is that EVERY starting number will eventually arrive at 1 or 89.

How many starting numbers below ten million will arrive at 89?
-------------------------------------------------------------------
Semi-bruteforce algorithm based on idea that we don`t need to construct full number chains from starting number until 1 or 89. Instead we will save in memory each starting number final result (1 or 89). And at the next starting number we will construct number chain only until previous calculated number.
Well solution is slow, but fits in "one minute rule" :-). Here it is-


import time as t

def nextnum(number):
n = number
s = 0
while n!=0:
m = n%10
n = n/10
s += m*m
return s

def untilknown(number):
start = number
res = []
while start >= number and start not in (1,89):
start = nextnum(start)
res += [start]
return res

def endswith89(limit):
seq = {1:1,89:89}
ret = 0
for x in range(1,limit):
if not seq.has_key(x):
k = untilknown(x)
if k:
kk = k[-1]
else:
kk = x
seq[x] = seq[kk]
if len(k) > 1:
for i in range(len(k)-1):
seq[k[i]] = seq[kk]
if seq[x] == 89:
ret += 1
return ret

t1 = t.time()
ans = endswith89(10000000)
t2 = t.time()

print ans, int(t2-t1),'s'


Have fun !!

Monday, October 27, 2008

Project Euler p99

Project Euler problem 99 description:
------------------------------------------------------------------------
Comparing two numbers written in index form like 2^11 and 3^7 is not difficult, as any calculator would confirm that 2^11 = 2048 < 3^7 = 2187.

However, confirming that 632382^518061 > 519432^525806 would be much more difficult, as both numbers contain over three million digits.

Using base_exp.txt (right click and 'Save Link/Target As...'), a 22K text file containing one thousand lines with a base/exponent pair on each line, determine which line number has the greatest numerical value.

NOTE: The first two lines in the file represent the numbers in the example given above.
------------------------------------------------------------------------
The trick of solution is not to compare whole numbers (because raising to power will be too much CPU time and memory consuming operation), instead we can compare logarithms of numbers. So actually we will compare LOG(number^power). Ok, but we still have to do power operation ? Well, no more ! By applying known logarithm formula: LOG(number^power) = power*LOG(number). So we are comparing power*LOG(number). This is very fast operation.
Problem solution is found in a 3.7 ms. Solution Python code:


import time as tm
import math as m

t1 = tm.time()*1000
f=open('base_exp.txt', 'r')
l=[i.strip().split(",")+[n+1] for (n,i) in enumerate(f.readlines())]
l = map(lambda i: (int(i[0]),int(i[1]), i[2]), l)
l = map(lambda (x,a,n): (a*m.log(x), n), l)
max = max(l)
t2 = tm.time()*1000

print max,t2-t1,'ms'


Have fun!

Saturday, October 11, 2008

Calculation of Pi

This time I tried to answer a question - what is the best method of calculating Pi to a required accuracy - for example,- 100 or 1000 or 10 000 decimal digits ?
So I chose 4 Pi formulas for testing:
1. Leibniz
2. Madhava transformed series
3. Machin like formula
4. Gauss algorithm
The idea for experiment - is to find out which algorithm gives more decimal digits of Pi in same number of iterations/terms. So measurement algorithm is this:
1. Calculate correct digits of Pi given from every Pi formula in each iteration.
2. Plot diagram - correct Pi decimal digits amount VS iteration number
(For this to work - you must have Matplotlib module).
Python code doing this stuff:


import inspect, time, sys
from decimal import Decimal, getcontext
from pylab import plot, show, xlabel, ylabel, title, grid, legend

def correct_digits(calcpi):
pi = "3.1415926535897932384626433832795028841971693993751058209749445923078164062862089986280348253421170679821480865132823066470938446095505822317253594081284811174502841027019385211055596446229489549303819644288109756659334461284756482337867831652712019091456485669234603486104543266482133936072602491412737245870066063155881748815209209628292540917153643678925903600113305305488204665213841469519415116094330572703657595919530921861173819326117931051185480744623799627495673518857527248912279381830119491298336733624406566430860213949463952247371907021798609437027705392171762931767523846748184676694051320005681271452635608277857713427577896091736371787214684409012249534301465495853710507922796892589235420199561121290219608640344181598136297747713099605187072113499999983729780499510597317328160963185950244594553469083026425223082533446850352619311881710100031378387528865875332083814206171776691473035982534904287554687311595628638823537875937519577818577805321712268066130019278766111959092164201989"
gd = 1000
for i,s in enumerate(zip(pi,str(calcpi))):
if s[0] != s[1]:
gd = i - 2
if gd < 0: gd = 0
break
return gd

def show_results(res):
x=range(len(res[0][2]))
plpar = ""
legpar = ""
for i in range(len(res)):
if plpar: plpar +=","
if legpar: legpar +=","
plpar += "x, res["+str(i)+"][2]"
legpar += "res["+str(i)+"][0][3:] +' ('+ str(int(res["+str(i)+"][1])) + 'ms)'"
plpar = "plot("+plpar+", linewidth=2.0)"
legpar = "legend(("+legpar+"), loc=0)"
exec(plpar)
exec(legpar)
xlabel('Iterations', fontsize = 15)
ylabel('Correct digits', fontsize = 15)
title("Convergence of some $\pi$ formulas",fontsize=20)
grid()
show()

def test_pi_formulas(pi_func_list):
res = []
terms = 6
print 'Calculating %d iterations...' % terms
getcontext().prec = 1002
for pif in pi_func_list:
t1 = time.time()*1000
name,r = pif(terms)
t2 = time.time()*1000
res.append((name,t2-t1,r))
show_results(res)

def pi_Leibniz(terms):
"""
http://en.wikipedia.org/wiki/Leibniz_formula_for_pi
"""
st = inspect.stack()[0][3]
ra = Decimal(0)
ans = []

for n in range(terms):
ra += Decimal(4*(-1)**n)/Decimal(2*n+1)
ans.append(correct_digits(ra))

return st,ans

def pi_Madhava(terms):
"""
http://en.wikipedia.org/wiki/Madhava_of_Sangamagrama#The_value_of_.CF.80_.28pi.29
"""
st = inspect.stack()[0][3]
ra = Decimal(0)
k = Decimal(12)**Decimal('0.5')
ans = []

for n in range(terms):
ra += Decimal((-1)**n)/Decimal((2*n+1)*(3**n))
ans.append(correct_digits(k*ra))

return st, ans

def pi_Machin(terms):
"""
http://en.wikipedia.org/wiki/Machin-like_formula
"""
st = inspect.stack()[0][3]
c1 = Decimal(1)/Decimal(5)
c2 = Decimal(1)/Decimal(239)
a = Decimal(4)
atan1 = Decimal(0)
atan2 = Decimal(0)
ra = Decimal(0)
ans = []

for n in range(terms):
atan1 += Decimal((-1)**n) * (c1**Decimal(2*n+1))/Decimal(2*n+1)
atan2 += Decimal((-1)**n) * (c2**Decimal(2*n+1))/Decimal(2*n+1)
ra = a * (a*atan1 - atan2)
ans.append(correct_digits(ra))

return st, ans

def pi_Gauss(terms):
"""
http://en.wikipedia.org/wiki/Gauss%E2%80%93Legendre_algorithm
"""
st = inspect.stack()[0][3]
one = Decimal(1)
ra = Decimal(0)
val = (one,one/(Decimal(2)**Decimal('0.5')),one/Decimal(4),one)
ans = []

for n in range(terms):
an, bn, tn, pn = val
an1 = (an+bn)/Decimal(2)
bn1 = (an*bn)**Decimal('0.5')
tn1 = tn - pn * (an - an1)**Decimal(2)
pn1 = Decimal(2) * pn
val = (an1, bn1, tn1, pn1)
ra = ((an+bn)**Decimal(2))/(Decimal(4)*tn)
ans.append(correct_digits(ra))

return st, ans

if __name__ == "__main__":
mod = sys.modules[__name__]
pifunc = []
for key, value in mod.__dict__.items():
if str(value)[:13] == '<function pi_':
pifunc.append(value)
test_pi_formulas(pifunc)


BTW this code is very scalable - if there is a need to test additional Pi formula - you only need to add new Pi function code like this:
"def pi_new_required_function(terms):
[...]". (Function name MUST begin with "pi_"). The rest program will do it for you - measure execution times, measure decimal digits correctness, plot results...
This is thanks to Python reflection used in program -> program scans itself for ALL pi functions and dynamically invokes them.

So after execution of this test we get such graph:


Conclusion
From graph can be seen that fastest converges Gauss Pi algorithm (from the chosen set of Pi formulas). So if you need for some reason to calculate Pi in desired accuracy (desired decimal places amount) I suggest Gauss algorithm. Because you will get result in less iterations / CPU cycles compared with other algorithms from the set.

Have fun!

Sunday, September 14, 2008

Detecting similar entropy zones in image

As I thought about information entropy one idea came to me - to write application which looks similar entropy zones in image. So after some time, I came with this algorithm (pseudo code):

1. Split image into 5x5 pixel image blocks
2. Calculate information entropy of these blocks (actually sum of entropy in 3 color channels)
3. Find similar entropy blocks.
4. [...] filter out small groups of blocks (seems like noise, huh ? ). Blah, blah...
5. Picture these similar entropy blocks on top of original image as red color layer.

Now real part (as you know already) - Python code which does the job [you need PIL module to run this]:


from PIL import Image
from math import *

def entropysum(pixels):
"""
Calculating information entropy for image
region and returning entropy sum for
all 3 color channels
"""
cr = [r for (r,g,b) in pixels]
cg = [g for (r,g,b) in pixels]
cb = [b for (r,g,b) in pixels]

er = 0.0
eg = 0.0
eb = 0.0

for r in set(cr):
p = float(cr.count(r))/len(cr)
if p > 0.0: er += -p * log(p,2)

for g in set(cg):
p = float(cg.count(g))/len(cg)
if p > 0.0: eg += -p * log(p,2)

for b in set(cb):
p = float(cb.count(b))/len(cb)
if p > 0.0: eb += -p * log(p,2)

return er + eg + eb

def decompose(image, block_len):
"""
Decomposing given image into some number of
smaller images of size block_len*block_len
"""
parts = []
w, h = image.size

for x in range(0, w, block_len):
for y in range(0, h, block_len):
locim = image.crop((x,y,x+block_len,y+block_len))
acc = entropysum(list(locim.getdata()))
parts.append((acc,x,y,locim))

parts.sort()

return parts

def similarparts(imagparts):
"""
Detecting similar image blocks by comparing
entropy of given images. Two images considered
being equal if entropy difference is not big.
"""
dupl = []

for i in range(len(imagparts)-1):
acc1, x1, y1, im1 = imagparts[i]
acc2, x2, y2, im2 = imagparts[i+1]

if acc1 == acc2 == 0:
gain = 0.0
else:
gain = 100.0 * (1.0 - acc1 / acc2)

if 0.01 < gain < 0.1 :
if imagparts[i] not in dupl:
dupl.append(imagparts[i])
if imagparts[i+1] not in dupl:
dupl.append(imagparts[i+1])

return dupl

def clusterparts(parts):
"""
Grouping nearest images into groups.
This is done, because we need to
filter out very small groups. We
want to know only big differences.
"""

filtparts = []
clust = {}
belongs = {}
w,h = parts[0][3].size

# assign all parts to clusters
for i in range(len(parts)):
acc, x, y, im = parts[i]
sides = []
sides.append(str(x)+str(y)+str(x+w)+str(y))
sides.append(str(x+w)+str(y)+str(x+w)+str(y+h))
sides.append(str(x)+str(y+h)+str(x+w)+str(y+h))
sides.append(str(x)+str(y)+str(x)+str(y+h))

# detect side already in cluster
fc = None
for s in sides:
if belongs.has_key(s):
fc = belongs[s]
break

# if this is new cluster
if fc == None:
fc = len(clust) + 1
clust[fc] = 1
else:
clust[fc] += 1

# set cluster for rectangle sides
for s in sides:
if not belongs.has_key(s):
belongs[s] = fc

# filter out small clusters
for i in range(len(parts)):
acc, x, y, im = parts[i]
side = str(x)+str(y)+str(x+w)+str(y)
cl = belongs[side]
if clust[cl] > 2:
filtparts.append(parts[i])

return filtparts

def marksimilar(image, dparts):
"""
Mark found similar image blocks on
original image, by applying red layer
on similar parts of image.
"""
if dparts:
colormask = Image.new('RGB', dparts[0][3].size,(255,0,0))
for (acc,x,y,im) in dparts:
im = Image.blend(im, colormask, 0.4)
image.paste(im,(x,y))

return image

if __name__ == '__main__':
im = Image.open("1.jpg")
ls = decompose(im, 5)
dparts = similarparts(ls)
cparts = clusterparts(dparts)
im = marksimilar(im, cparts)
im.show()


So these are the results after running this script on several images:


Conclusion

So this algorithm is an interesting tool for exploration of information entropy in image. Maybe in some cases it could be a tool for analyzing very similar texture zones. BTW information entropy may be used for hashing image. Hashing image is useful, because it lets us to search similar images in database (for example) by its hash.

Have fun !

Sunday, August 31, 2008

Number of runs in random sequence

While reading this article about human ability on outputing random data-
http://faculty.rhodes.edu/wetzel/random/mainbody.html
I started to think - How we can simply detect that entered sequence is NOT random ( or entered by human) ? Of course to make some real-world measurements we need statistics a lot. But if we need just some straightfoward method for preliminary results ? Well, the idea was to check the number of runs in sequence and to compare the result with the expected value. (Number of runs is total number of subsequences in sequence).
So that if number_of_runs != expected_number_of_runs then we can conclude that data is not much random. OK. Number of runs we can measure simply. But what about expected_number_of_runs ? Somehow I suspected that this expected runs count should be dependent on the random variable values amount. For example sequences 'azazaz' and 'azxazx' are the same length, but one is composed of a,z (2 values) and second- a,z,x (3 values). So if we know what is going on with the number_of_runs when random sequences is composed from different values amount - we may calculate expected_number_of_runs given any sequence. Second point - for eliminating need to recalculate everything when sequence length changes - better calculate expected_number_of_runs / sequence_length.
So I made such experiment for detection of such dependancy.
Experiment Python code (to run it you need matplotlib python module):


from random import *
from pylab import plot, show, xlabel, ylabel, title, grid, legend

def runs(lst):
return sum([int(not lst[i]==lst[i+1]) for i in range(len(lst)-1)])+1

def testruns(n):
s=[randint(1, n) for x in range(10000)]
return float(runs(s)) / len(s)

max = 20
xrange = range(2, max)
yruns = [testruns(x) for x in xrange] # Generating random data and counting runs
yreg = [1.0-1.0/x for x in xrange] # Function for fitting data
plot(xrange, yruns , 'ro', xrange, yreg)
xlabel('Variable values amount')
ylabel('Number of runs per item')
title('Number of runs dependance on variable values amount')
legend(('Experimental' , 'Data fit: ' r'$1-n^{-1}$'), loc=7)
grid()
show()


So after running this random data test- we get such plot:

So it tells us that expected_number_of_runs we need to calculate like that-
expected_number_of_runs = sequence_length * (1 - 1/n);
n- unique element count in sequence. So now we have some tool for detecting sequence being not much random.
First- we measure real number_of_runs in sequence.
Second - we calculate expected_number_of_runs.
Third - if these two values is not approximately equal - then we can conclude that data is not random. Of course we can`t be sure about randomness just from this test.
We need a lot of different measures - information entropy and as such... But
the goal of this article was to play with number_of_runs. Maybe later - I will write something about information entropy. It is very interesting also.

Have fun!!!

Wednesday, August 27, 2008

Codegolf - Vigenere Cipher

Problem definition:
---------------------------------------------------
The Vigenere cipher is a simple form of a polyalphabetic substitution, using a series of different Caesar ciphers based on the letters of a keyword. It's over 450 years old now, but that shouldn't stop us having a bit of golfing fun with it now.

The following information is largely taken from Wikipedia's Vigenere cipher page. You might find some interesting information that isn't included here, so I recommend you check it out.

Your job is to write some code which takes a keyword and some plaintext, and encrypts it according to the Vigenere cipher.

In a Caesar cipher, each letter of the alphabet is shifted along some number of places; for example, in a Caesar cipher of shift 3, A would become D, B would become E and so on. The Vigenere cipher consists of several Caesar ciphers in sequence with different shift values.

To encipher, a table of alphabets can be used, termed a tabula recta, Vigenere square, or Vigenere table. It consists of the alphabet written out 26 times in different rows, each alphabet shifted cyclically to the left compared to the previous alphabet, corresponding to the 26 possible Caesar ciphers. At different points in the encryption process, the cipher uses a different alphabet from one of the rows. The alphabet used at each point depends on a repeating keyword.

Click here to see the Vigenere square.

See the examples section below for a worked example.
More Information

* Your code will be given both the keyword and the plaintext on stdin. It will be in the format

KEYWORD
PLAINTEXT

with newlines at the end of each line.

* You should print the encrypted plaintext on stdout.
* Both the keyword and the plaintext will contain only the uppercase letters A through Z.
* Your code will be run three times and will need to pass all three tests to be deemed successful.
---------------------------------------------------
Code golf challenge is interesting because it measures your ability to write code as short as possible. My try to give shortest solution in Python:

Run no 1 -> code size 111 bytes:


k=raw_input()*100;p=raw_input()
print ''.join(map(lambda x, y: chr(65+(ord(x)+ord(y)-130)%26), k[:len(p)], p))


Run no 2 -> code size 84 bytes:


i=raw_input;print ''.join(chr(65+(ord(x)+ord(y)-130)%26) for x,y in zip(i()*10,i()))


Have fun!
Code golf

Monday, August 25, 2008

Project Euler p22

Problem description:
-----------------------------------------------------------
Using names.txt (right click and 'Save Link/Target As...'), a 46K text file containing over five-thousand first names, begin by sorting it into alphabetical order. Then working out the alphabetical value for each name, multiply this value by its alphabetical position in the list to obtain a name score.

For example, when the list is sorted into alphabetical order, COLIN, which is worth 3 + 15 + 12 + 9 + 14 = 53, is the 938th name in the list. So, COLIN would obtain a score of 938 * 53 = 49714.

What is the total of all the name scores in the file?
-----------------------------------------------------------
Solution in Python:


def ReadFile():
""" Read data input file"""
f = open('C:/ProjectEuler/names.txt','r')
str = f.readlines()
f.close()
str[0] = str[0].replace('"','')
ret = str[0].split(',')
ret.sort()
return ret

def AlphabeticalValue(string):
alph = list('ABCDEFGHIJKLMNOPQRSTUVWXYZ')
values = map(lambda x: alph.index(x)+1, list(string))
return sum(values)

def TotalScore():
names = ReadFile()
namsc = map(lambda (x,y): AlphabeticalValue(y)*(x+1), list(enumerate(names)))
return sum(namsc)

if __name__ == '__main__':
print TotalScore()


What is missing ? Of course - Have fun :-)

Friday, July 11, 2008

Google codejam 2008 contest practice test

This time we will probe Google famous CodeJam contest. We will try to solve codejam 2008 one of practice tests. Test problem is defined as:
-----------------------------------------------------------------------
Problem

You're interested in writing a program to classify triangles. Triangles can be classified according to their internal angles. If one of the internal angles is exactly 90 degrees, then that triangle is known as a "right" triangle. If one of the internal angles is greater than 90 degrees, that triangle is known as an "obtuse" triangle. Otherwise, all the internal angles are less than 90 degrees and the triangle is known as an "acute" triangle.

Triangles can also be classified according to the relative lengths of their sides. In a "scalene" triangle, all three sides have different lengths. In an "isosceles" triangle, two of the sides are of equal length. (If all three sides have the same length, the triangle is known as an "equilateral" triangle, but you can ignore this case since there will be no equilateral triangles in the input data.)

Your program must determine, for each set of three points, whether or not those points form a triangle. If the three points are not distinct, or the three points are collinear, then those points do not form a valid triangle. (Another way is to calculate the area of the triangle; valid triangles must have non-zero area.) Otherwise, your program will classify the triangle as one of "acute", "obtuse", or "right", and one of "isosceles" or "scalene".

Input

The first line of input gives the number of cases, N. N test cases follow. Each case is a line formatted as

x1 y1 x2 y2 x3 y3

Output

For each test case, output one line containing "Case #x: " followed by one of these strings:

* isosceles acute triangle
* isosceles obtuse triangle
* isosceles right triangle
* scalene acute triangle
* scalene obtuse triangle
* scalene right triangle
* not a triangle

Limits

1 ≤ N ≤ 100,
x1, y1, x2, y2, x3, y3 will be integers.

Sample Input

0 0 0 4 1 2
1 1 1 4 3 2
2 2 2 4 4 3
3 3 3 4 5 3
4 4 4 5 5 6
5 5 5 6 6 5
6 6 6 7 6 8
7 7 7 7 7 7

Sample Output

Case #1: isosceles obtuse triangle
Case #2: scalene acute triangle
Case #3: isosceles acute triangle
Case #4: scalene right triangle
Case #5: scalene obtuse triangle
Case #6: isosceles right triangle
Case #7: not a triangle
Case #8: not a triangle

-----------------------------------------------------------------------
This time solution is written in Python language. To test this solution you need to have Python interpreter installed. You can install it from www.python.org. For trying this script- paste Sample Input lines into file named 'A-large.in' and place this file into the same folder where below mentioned Python script will be. Script is somewhat fast - 100 sample triangles is analyzed in just 2.2 ms !!!. Script code:


#!/usr/bin/env python

import sys, time

def ReadFile():
""" Read data input file"""
path = sys.path[0]
f = open(path + '/A-large.in','r')
str = f.readlines()
f.close()
return str

def IsTriangle(p):
"""Defines triangle by it`s area"""
area = (p[0]*(p[3]-p[5])+p[2]*(p[5]-p[1])+p[4]*(p[1]-p[3]))
if area == 0:
return 'not a triangle'
else:
return 'triangle'

def SideType(p):
"""Defines triangle by sides lengths"""
s1 = ((abs(p[0]-p[2])**2)+(abs(p[1]-p[3])**2))**0.5
s2 = ((abs(p[0]-p[4])**2)+(abs(p[1]-p[5])**2))**0.5
s3 = ((abs(p[2]-p[4])**2)+(abs(p[3]-p[5])**2))**0.5
if s1!=s2 and s1!=s3 and s3!=s2:
return 'scalene'
if s1==s2 or s1==s3 or s3==s2:
return 'isosceles'

def AngleType(p):
"""Defines triangle type by angle.
Idea based on Pythagorean theorem and somewhat
empirical hack about 'not perfect' right triangles ->
for which (a^2+b^2)/c^2 is only approximately 1.
And the more angle shifts from 90 degrees, the
more (a^2+b^2)/c^2 relation shifts from 1"""
s1 = ((abs(p[0]-p[2])**2)+(abs(p[1]-p[3])**2))**0.5
s2 = ((abs(p[0]-p[4])**2)+(abs(p[1]-p[5])**2))**0.5
s3 = ((abs(p[2]-p[4])**2)+(abs(p[3]-p[5])**2))**0.5
k1 = round(float((s1**2)+(s2**2))/float(s3**2),3)
k2 = round(float((s1**2)+(s3**2))/float(s2**2),3)
k3 = round(float((s3**2)+(s2**2))/float(s1**2),3)

if k1==1.0 or k2==1.0 or k3==1.0:
return 'right'
elif k1<1.0 or k2<1.0 or k3<1.0:
return 'obtuse'
else:
return 'acute'

def ComputeResults():
out = []
for i,s in enumerate(ReadFile()):
pt = map(int,s.rstrip().split())
if pt.__len__() != 1:
tr = IsTriangle(pt)
st = ''
at = ''
if tr == 'triangle':
st = SideType(pt) + ' '
at = AngleType(pt) + ' '
tot = 'Case #' + str(i) + ': ' + st + at + tr + '\n'
out.append(tot)
return out

def WriteFile(lst):
""" Write results to data file"""
path = sys.path[0]
f = open(path + '/A-large.out','w')
f.writelines(lst)
f.close()

if __name__ == '__main__':
t1 = time.time()*1000
res = ComputeResults()
t2 = time.time()*1000
WriteFile(res)
print 'Done.'
print 'Computation time ',round(t2-t1,3),'ms'
print 'Results are written in file A-large.out'


Have fun !